|
|
|
|
|
|
| Deforestation Figures for Brazil
|
Year | Deforestation
[sq mi] | Deforestation
[sq km] |
| | |
| 1978-1988* | 8158 | 21,130 |
| 1990 | 5,332 | 13,810 |
| 1991 | 4,297 | 11,130 |
| 1992 | 5,322 | 13,786 |
| 1993 | 5,950 | 15,410 |
| 1994 | 5,751 | 14,896 |
| 1995 | 11,219 | 29,059 |
| 1996 | 7,013 | 18,160 |
| 1997 | 5,034 | 13,040 |
| 1998 | 6,501 | 16,840 |
| 1999 | 6,663 | 17,259 |
| 2000 | 7,658 | 19,836 |
| 2001 | 7,027 | 18,130 |
| 2002 | 9,845 | 25,500 |
| 2003 | 9,343 | 24,130 |
All figures derived from official National
Institute of Space Research (INPA) figures
*For the 1978-1988 period the figures represent
the average annual rates of deforestation.
|
|
|
Brazil: New Infrastructure Projects Cause Deforestation in the Amazon Rainforest
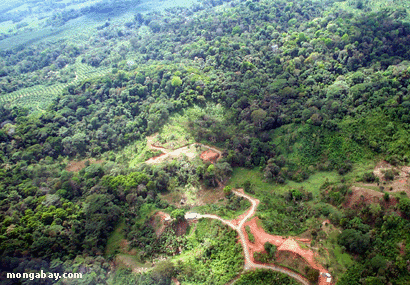
According to a report in Science (21 May 2004), infrastructure development projects are a significant contributor to increasing deforestation in Brazilian rainforest. Since 2000, when the Brazilian government announced a development plan known as 'Avança Brasil', more than 33,000 square miles (87,000 sq km) of forests have been lost. Avança Brasil called for a dramatic expansion of new highways, railroads, power lines, pipelines, hydroelectric reservoirs, and river-channelization projects across the Amazon Basin.
These new infrastructure projects open previously inaccessible rainforest lands to development for cattle ranching, subsistence agriculture, and industrial soybean farming. To learn more on deforestation in Brazil, check out:
The Trans-Amazonian Highway
Deforestation in the Amazon 2004
Saving the Amazon Rainforest
Soybeans in the Amazon
|
|